Analyse your local network traffic with PCAP files
NetCapVis is in active development with new algorithms and techniques from scientific publications. Some functions are experimental.
Try it yourself!
Checkout the demo file to explore the visualizations offered by NetCapVis or drag your file into the window to upload.
Drag your file to the center area or press the button to upload your PCAP files and analyze them interactively using many different visualizations.
We process the different headers to visualize different kinds of traffic and additionally apply machine learning techniques to provide further insights.
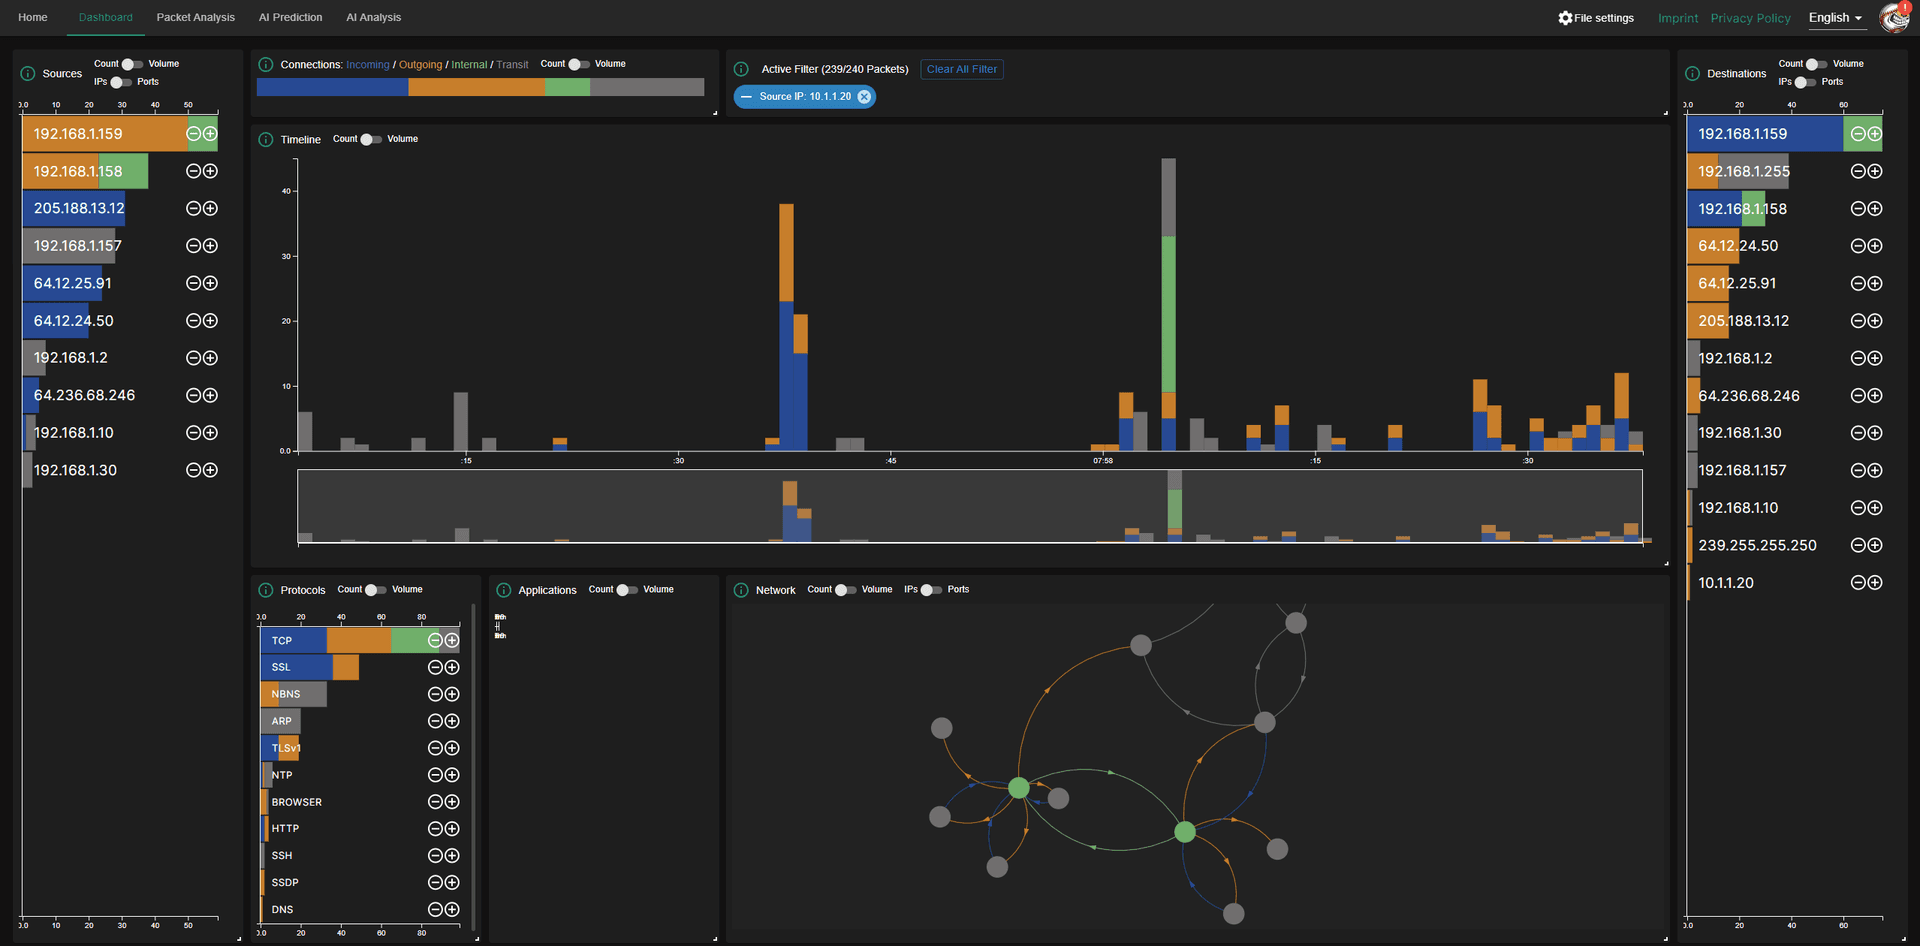
The Dashboard provides overview over the IP and Transport Layer properties like IP addresses and ports.
A network graph shows the connections between the machines in the network and the AI classification shows that applications using the network.

Going deeper into each packet the Packet Analysis and AI Prediction Page show the detailed packet content and the latter the complete Class Activation Map (CAM) that was output by the machine learning model predicting the application of the packet.

The newest addition to NetCapVis is the AI Analysis page. Here we present all Class Activation Maps (CAMs) aggregated per class of application (e.g. all Zoom packets aggregated).
The user can use the interface to edit the impact of single bytes to create more accurate additional classes to improve the model.
